Category Archives: Maps

Florida, Illinois, Missouri, North Carolina, Ohio, Primaries – March 15, 2016

Who will win your state, your county, your city, your precinct? Using public data and free online mapping tools anyone can analyze an election. Steps to analyzing an election: 1. Map boundaries: States; townships, precincts 2. Election data –possible sources include: –county websites; –US Census http://www.census.gov/hhes/www/socdemo/voting/ –United States Election Project http://www.electproject.org/home/voter-turnout/voter-turnout-data –Esri Open Data http://opendata.arcgis.com/ […]

Read More

How Many Languages Do You Speak Fluently?

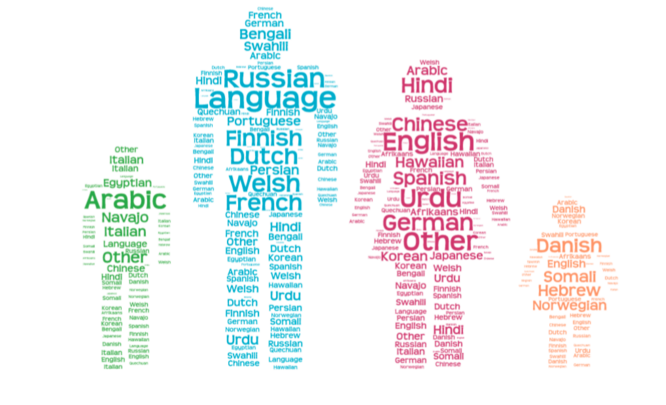
Do you speak one, two, three, four or even 57 languages? Put your dot on the map with the number of languages you speak. Click here to participate in the Language Survey The Language Survey is a crowd-sourced, map, created for an exercise in the “Do-It-Yourself Geo Apps” MOOC. I am learning so much in […]

Read More

Hey Illinois, you’re normal!

Yes, really! An interesting study conducted in 2014 by the Business Insider lists the 11 most normal states in the U.S. This article explains in detail the analysis that went into their ranking, including the indicators that were used for their study. http://www.businessinsider.com/the-most-average-states-in-america-2014-4#. Try it Yourself! Your state might not be as normal as Illinois […]

Read More